
Full crypto screener guide
Explore a comprehensive guide detailing the interface and all features of the stakan.io crypto screener
We have launched the crypto screener, and in this article, we provide a detailed description of all its functions and features.
The key features of the stakan.io screener:
- Realtime order book and candlestick chart as well as large densities in the order book
- Over 1500 spot and futures trading pairs from Binance
- Price change alerts to either a browser or Telegram
Let's further break down every feature and button of our crypto screener.
Main screen
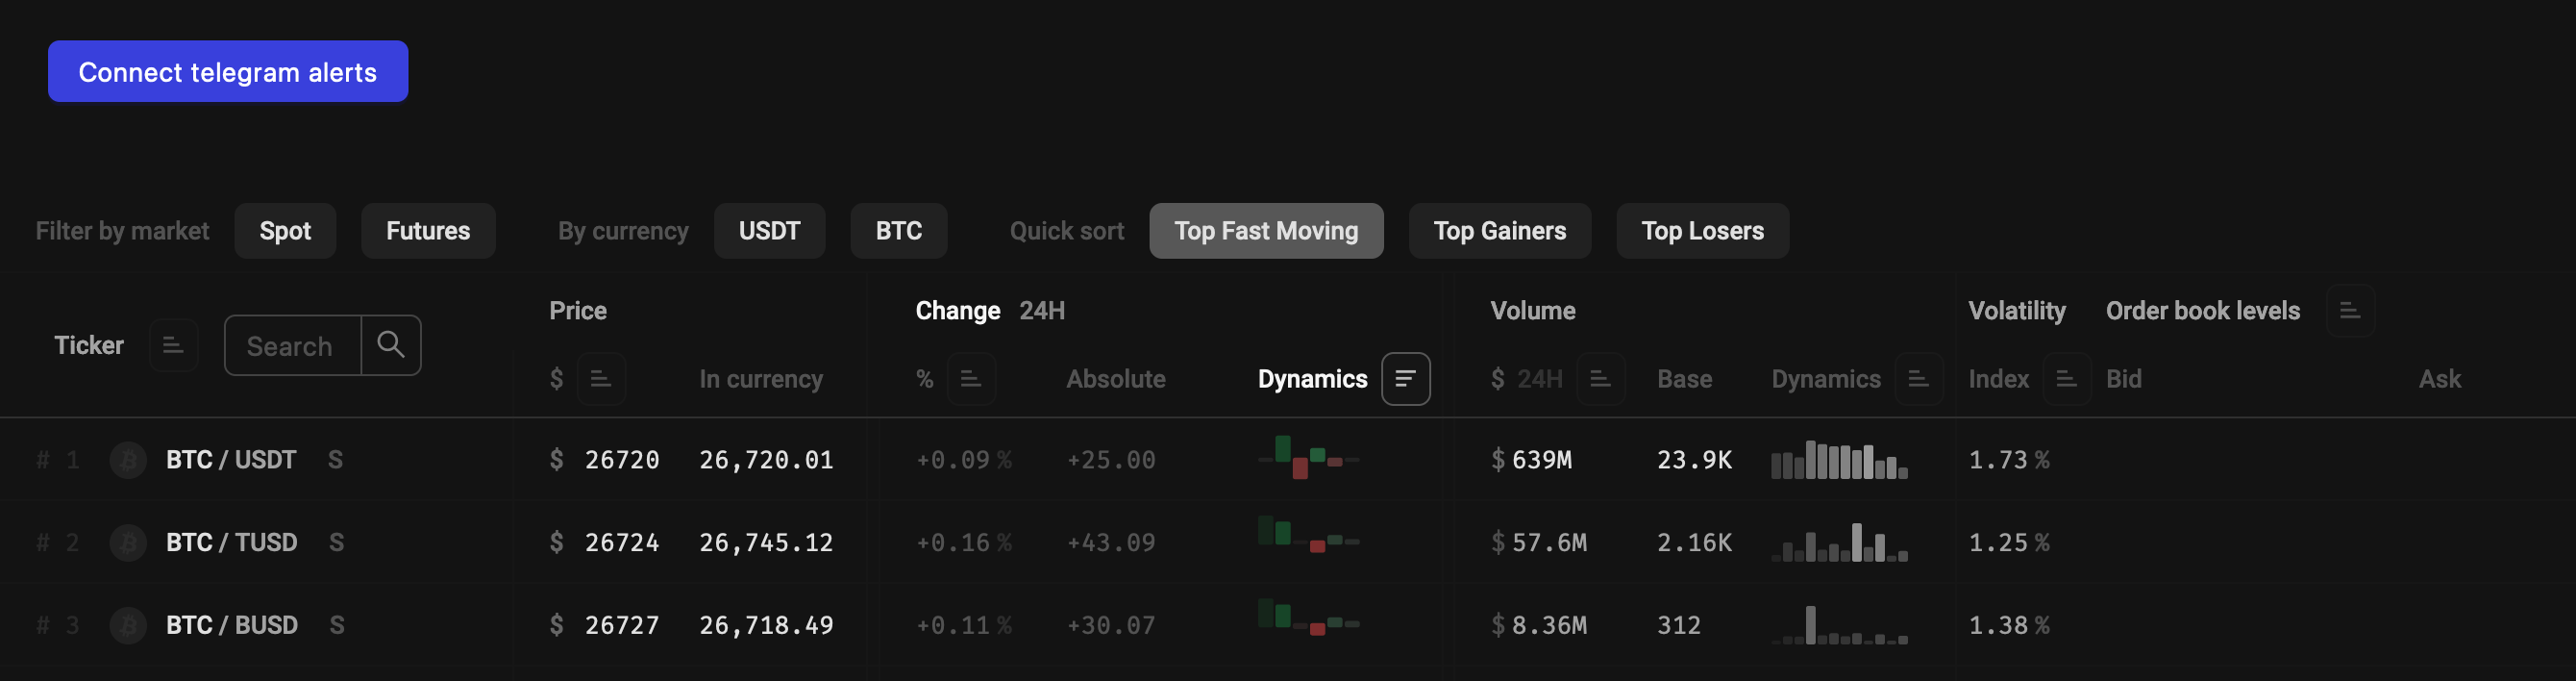
The main section of the screener is the table containing information about all trading pairs. Each trading pair is represented in the form of columns, providing various market data.
Ticker - The column displays the trading pair's name along with the corresponding market type, distinguishing between spot and futures markets. Adjacent to the name, there is an accompanying index number indicating the current position of a trading pair in the sorting order.
The sorting button, located next to the column header, arranges all trading pairs in alphabetical order.
Price - Here, you can find two numbers: the price of a coin in U.S. Dollars and the price in the quoted currency of a pair, typically USDT or BTC. You have the option to sort trading pairs based on their US Dollar prices.
Change 24H - The column indicates the price change over the last 24 hours, presented either in percentages or absolute values. Additionally, you have the option to sort the table based on the percentage change in price.
Next to the price change data, there is a compact chart displaying price change dynamics. The chart consists of six bars, with the most recent data on the right. The rightmost bar represents the price change in the last 5 minutes, followed by changes in the previous 15 minutes, 1 hour, 4 hours, 12 hours, and 24 hours. While the entire chart covers approximately 40 hours of price movements, it particularly emphasizes the most recent significant changes.
You can sort the table based on price dynamics. For instance, if you sort it in descending order, the top entries will display trading pairs that experienced significant price movements in the last 5 minutes.
Volume - The column showcases the trading volume of a pair over the last 24 hours. You can view the trading volume both in U.S. Dollars and in the base currency of the pair. Additionally, you have the option to sort the table based on trading volume in U.S. Dollars.
Next to the trading volume, there is a chart displaying the volume dynamics over the last hour.
Volatility - Indicates the percentage magnitude of price changes for the trading pair. While it doesn't specify the direction of the movements, it is useful for assessing the overall volatility of the price.
Let us delve into the last column in more detail.
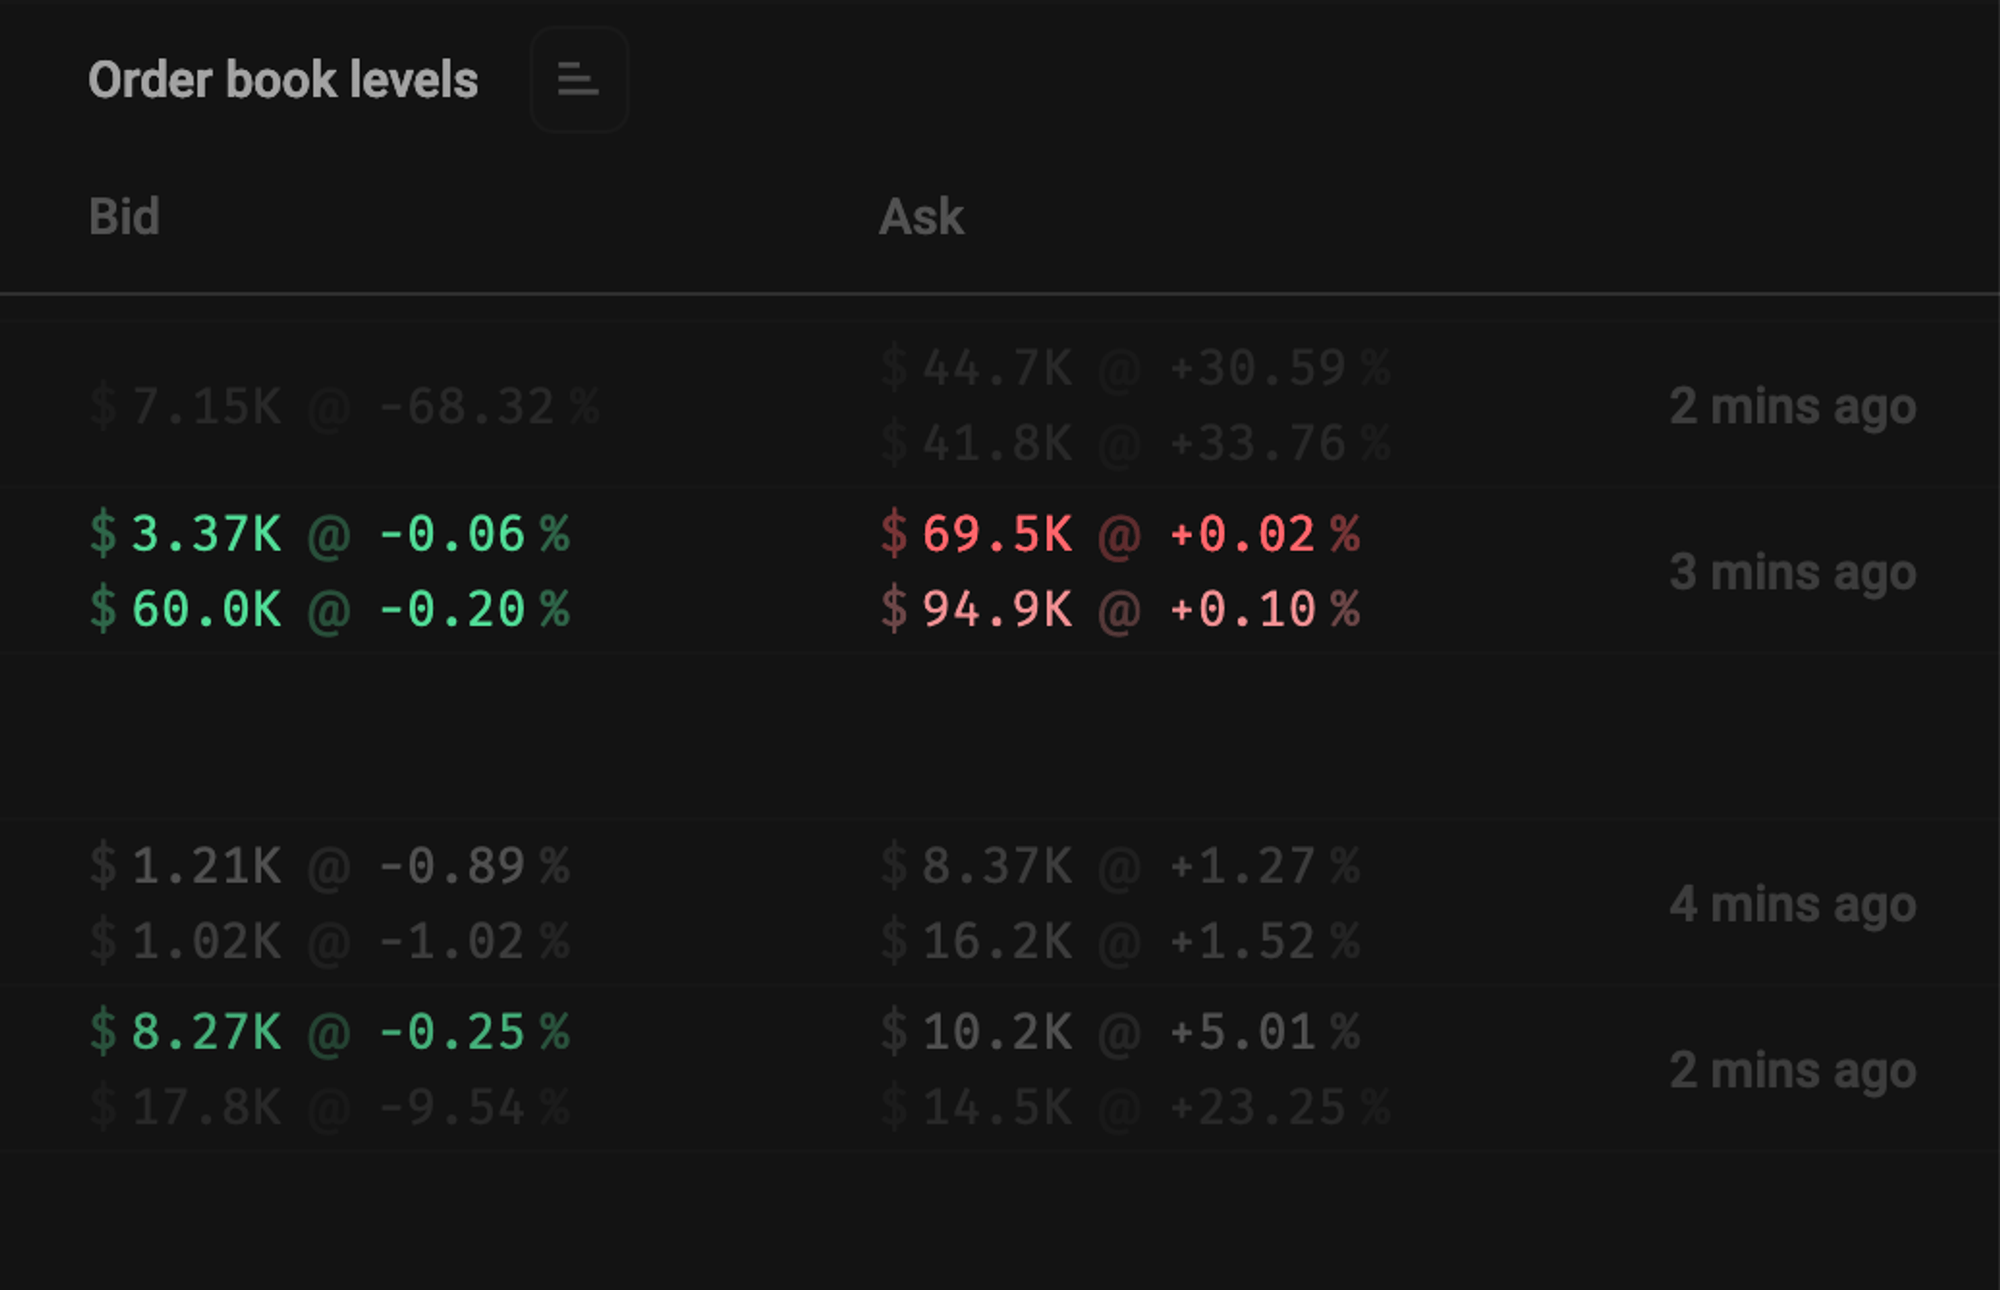
Order Book Levels - This column displays significant orders in the order book identified by our scanner. These orders are substantial compared to the current trading volume, indicating their potential to influence future price movements.
Here's an example: $69.5K represents the order size in U.S. Dollars, which equals $69,500. Additionally, +0.02% signifies the distance from the current market price to the price of the order.
How Large Densities are Determined
Density refers to orders that are abnormally large in volume for a particular pair. We consider density to be anomalous when the volume is slightly larger than the average volume of the pair based on five-minute candlesticks.
How are densities sorted in the screener?
When sorting densities in the screener, we take into account:
- Removing all densities smaller than 100k USDT
- The size of the density
- Proximity to the spread
- Pair volatility
Taking into account all three factors, we "weigh" the quality of the density and position the pair in the list according to the "weight" of the density.
For example, there are two densities with the same volume, both located 2% away from the spread. However, one of the pairs moves 0.5% per day, while the other moves 10% per day. Consequently, the first density will have a low "weight," and the second will have a "high" weight due to the volatility factor.
Additionally, in the latest update, we added a Spot/Futures filter and moved some types of sorting to a special quick menu.
In the latest update, we introduced new features, including filters for market types (Spot/Futures), currency filters, and quick sorting options.
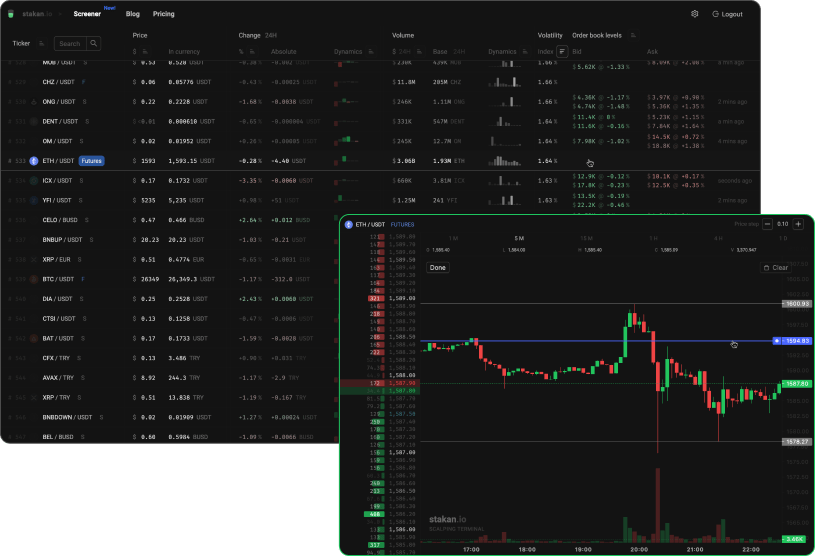
Realtime order book and candlestick chart
Click on any trading pair to open a window displaying a candlestick chart and the order book. Here is what it looks like:
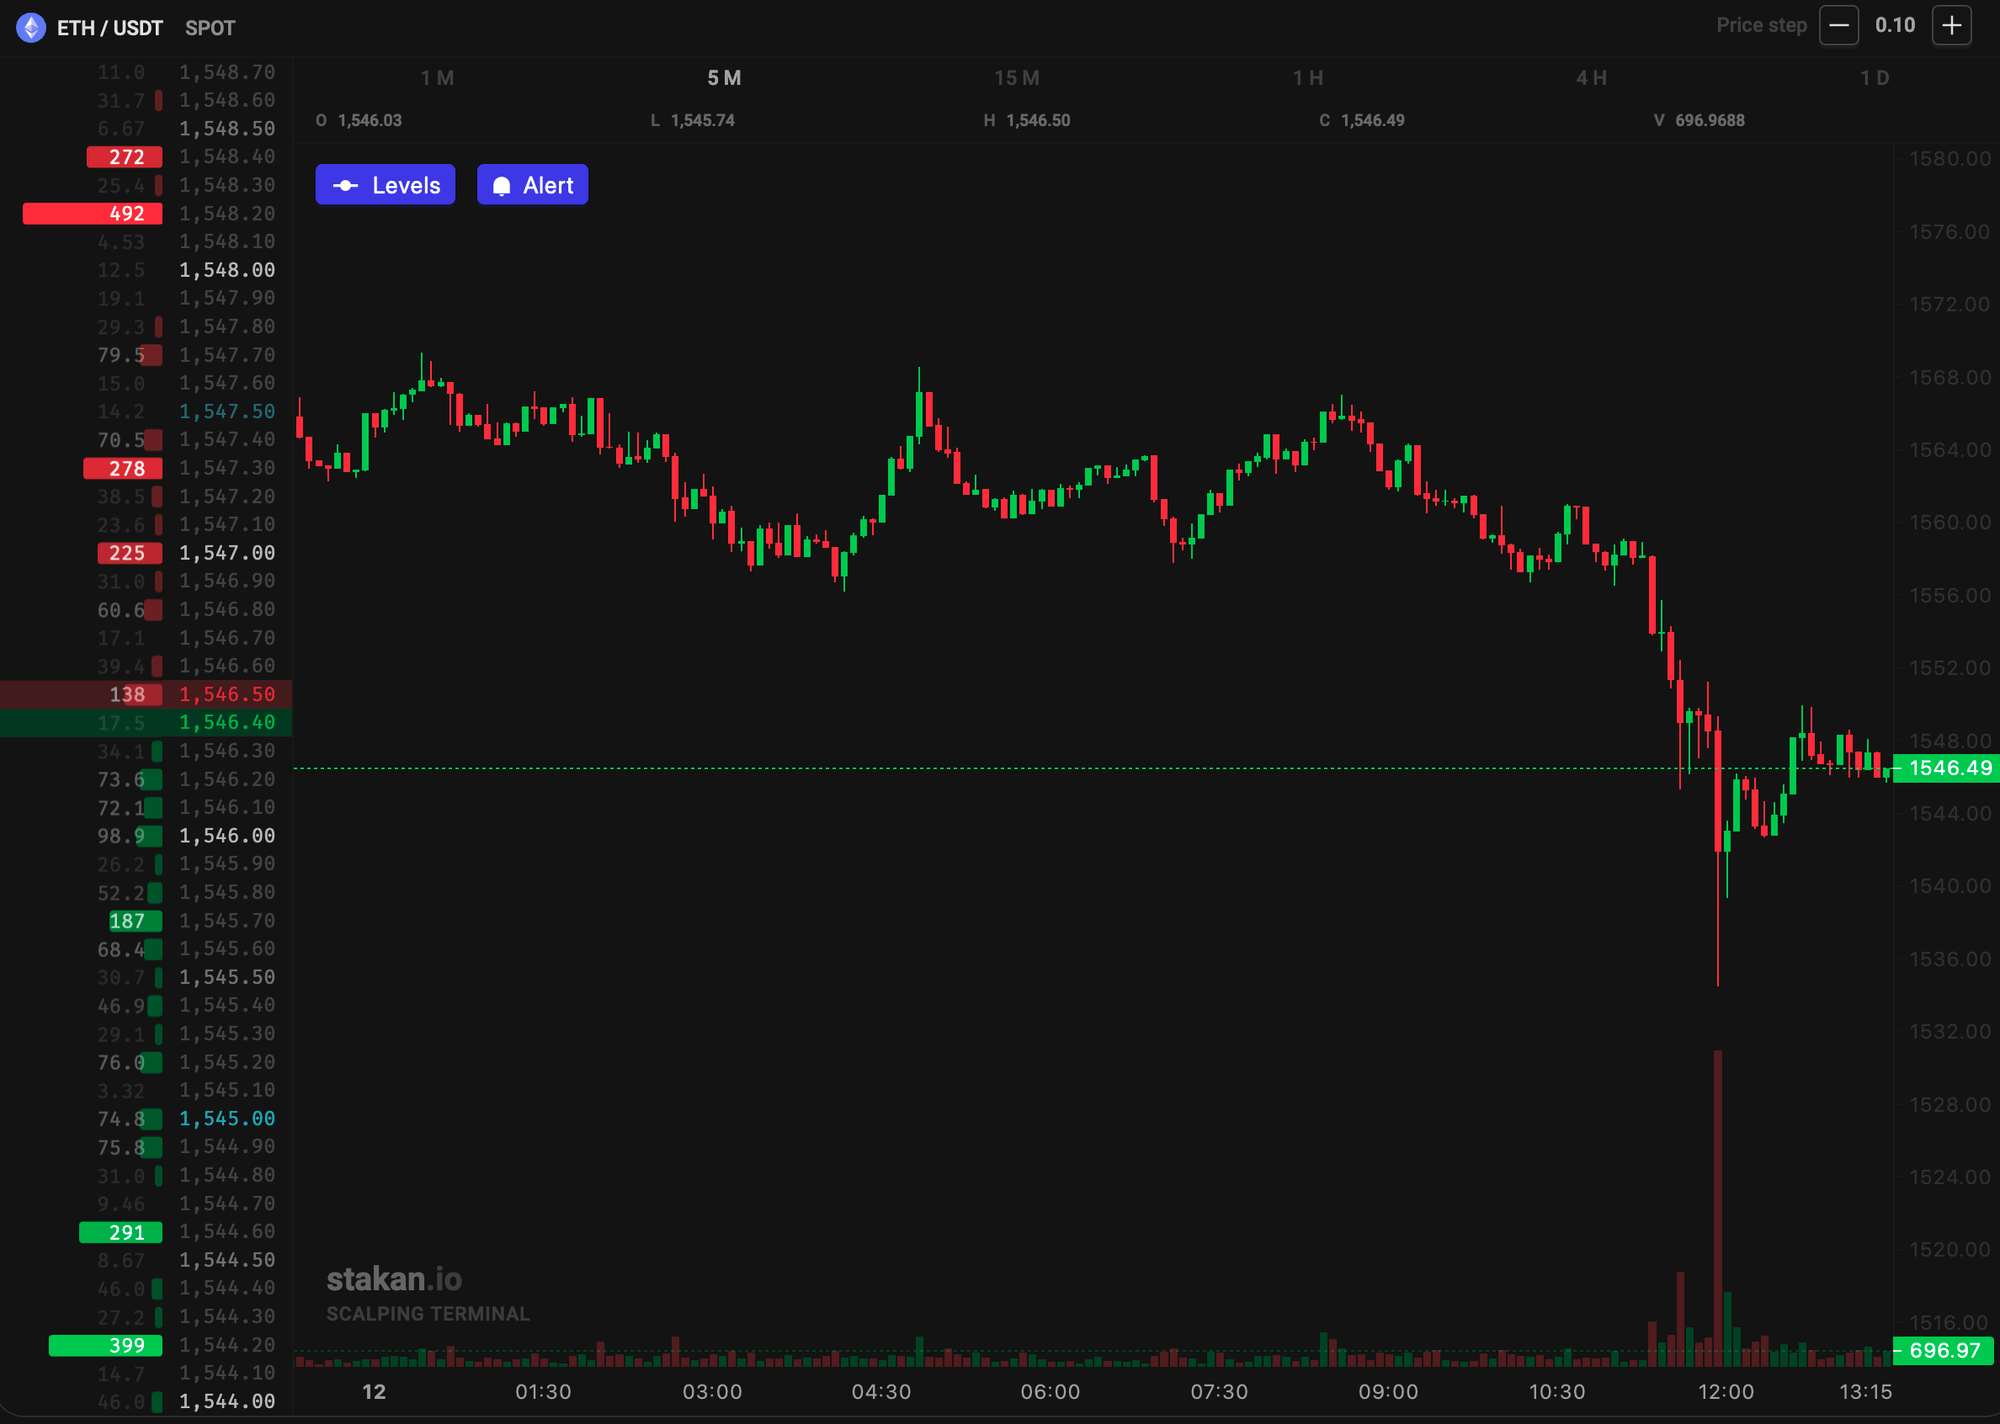
Chart layout
The left side of the window features the order book, while the right side is dedicated to the candlestick chart, drawings, and trading volume chart.
Moreover, on the candlestick chart, you can observe current order densities from the order book, represented as solid green and red lines.
In the upper left corner, you can see the trading pair and market type (spot or futures). In the upper-right corner, there are controls for the order book price step. Click the plus sign to zoom out the order book and increase its density, while the minus sign will zoom in, making price levels sparser.
Placing, adjusting levels, and alerts
The blue “Levels” button allows you to set horizontal levels on the chart. When pressed, and you hover the mouse cursor over a section of the candlestick chart, a gray line will appear. Clicking on the level you are interested in will mark it on the chart.
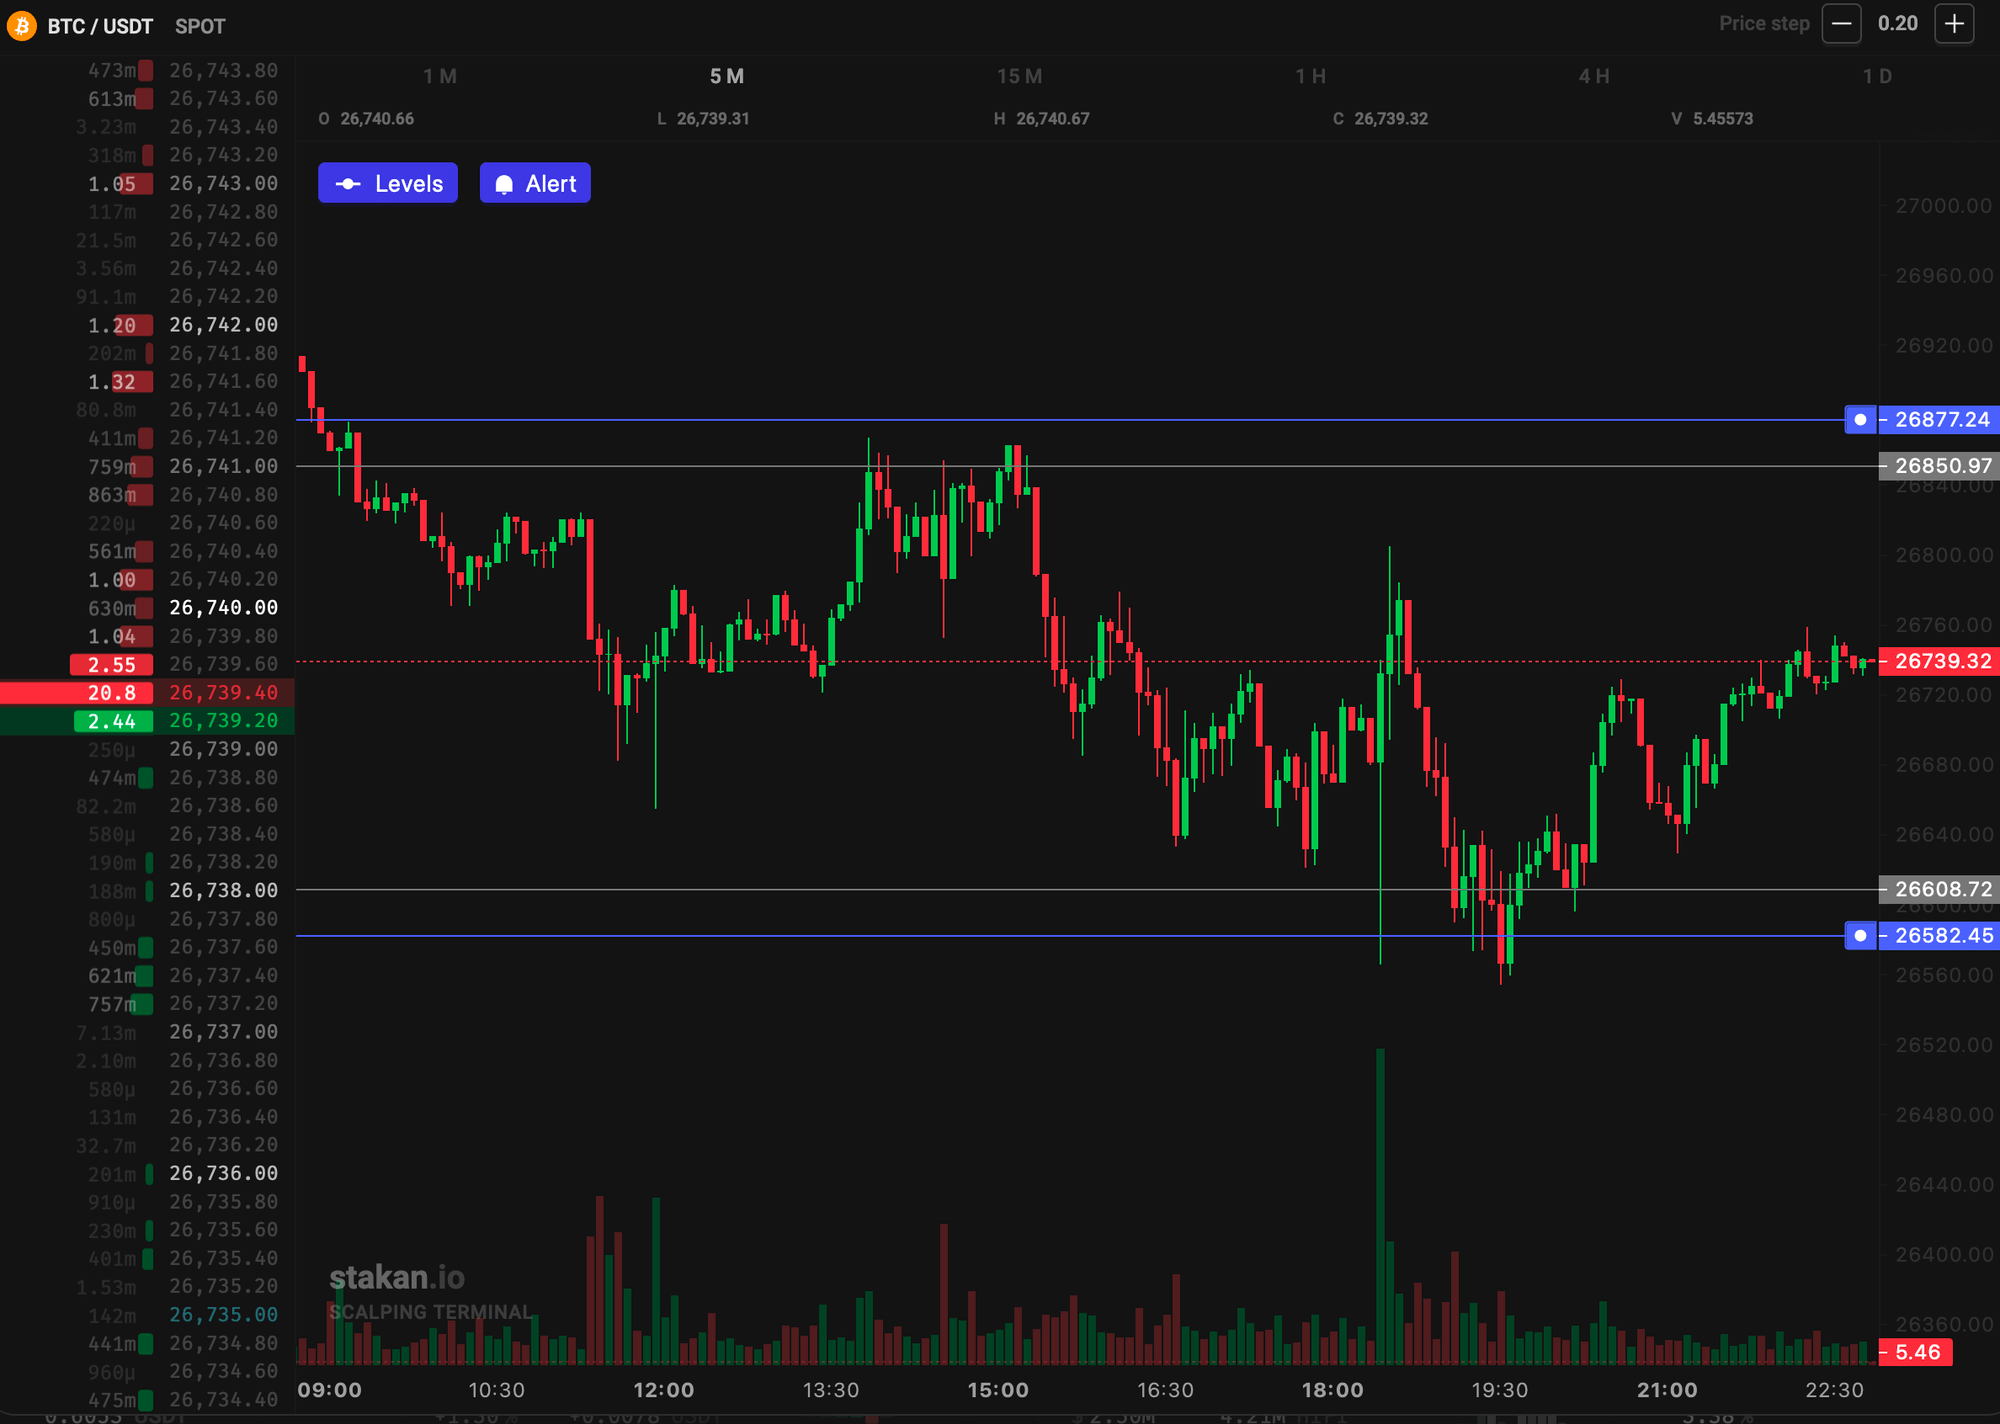
Once placed, the level is automatically saved. Additionally, you can access the drawing of levels mode by pressing the “L” key. In this mode, to remove a level, hover the cursor over it and press “Backspace” or “Delete” on the keyboard, to adjust a level's price, simply click on it and move it to the desired position.
Adjacent to the Levels button, there is the “Alert” button, which operates on a similar principle. It allows you to set a specific price, just like Levels, but the line is blue. When the price reaches the marked level, you will receive a browser or Telegram notification.
Alerts come in two types:
- Browser notifications
- Messages from a dedicated Telegram bot
Alerts can be saved and deleted in the same way as levels.
Hotkeys for drawing mode
L – Open levels
A – Open alerts
Backspace / Del – delete an active level or alert on which the cursor is hovering
Shift – measure price range with a ruller
Esc – Exit drawing mode
With this, we conclude our overview of the crypto screener. Now it's your turn to experience it for your trading needs. Dive in and explore the powerful features awaiting you!